Create Custom Dashboard
Amazon EC2 provides instance-level metrics that measure CPU, disk, and network performance. These metrics include bytes and packets in/out and collected by default and can be viewed in Amazon CloudWatch. Amazon EC2 has recently announced additional high-resolution instance level network performance metrics for Elastic Network Adapter (ENA). With these new metrics you can gain insights into traffic drops when network allowances are exceeded. For more information, please see Amazon EC2 instance-level network performance metrics uncover new insights
In this section we will review the Network metrics in CloudWatch for the VPC A Private AZ1 Server instance in VPC A and create a custom dashboard with a widget showing the NetworkIn and NetworkOut metrics and another widget for the NetworkPacketsIn and NetworkPacketsOut metrics.
-
Navigate to the CloudWatch console
-
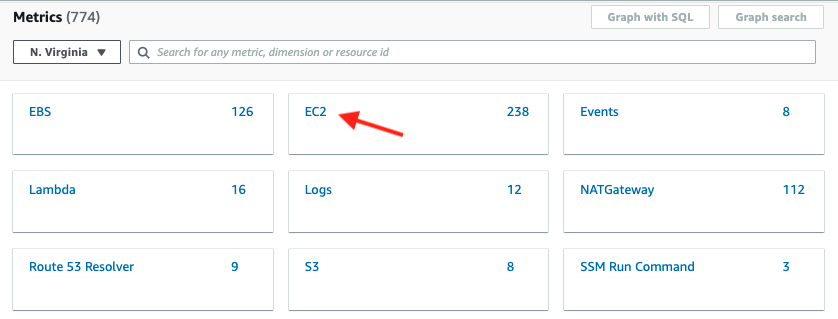
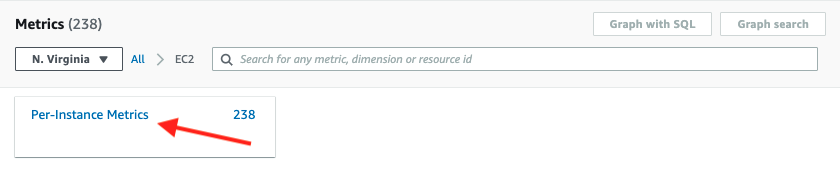
Under the All Metrics tab in the main screen click on EC2
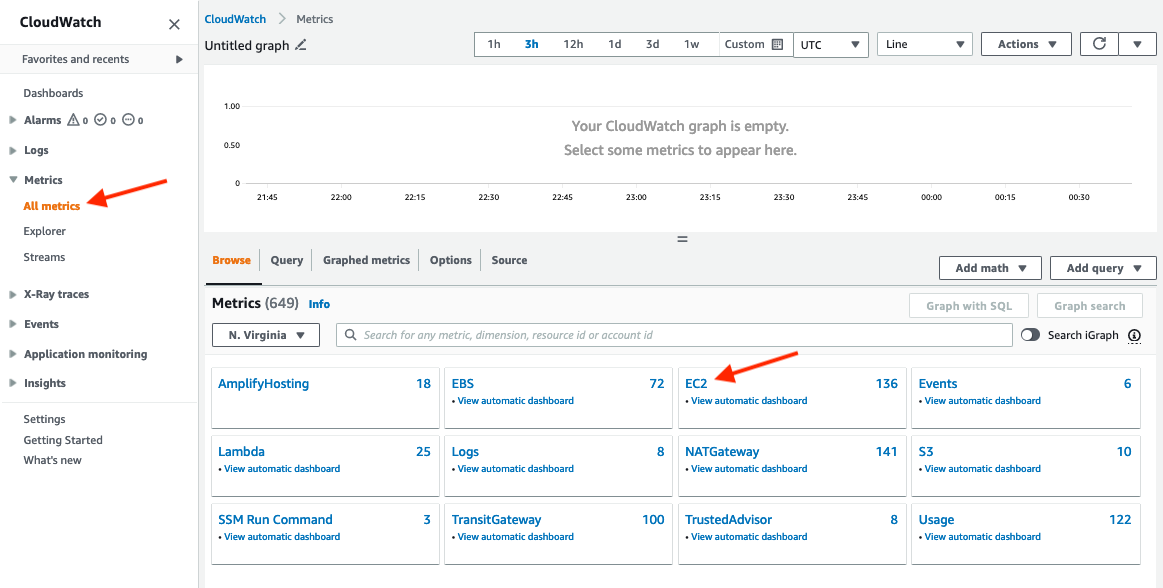
-
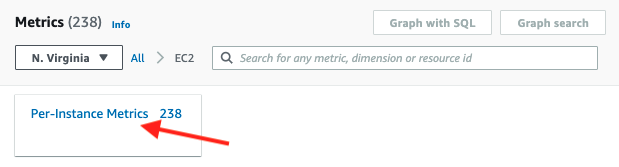
Click on Per-Instance Metrics.
-
Filter the list for metrics with network in the name by entering network in the search
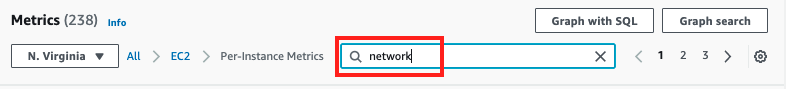
-
Select the metric NetworkIn and NetworkOut for the
VPC A Private AZ1 Server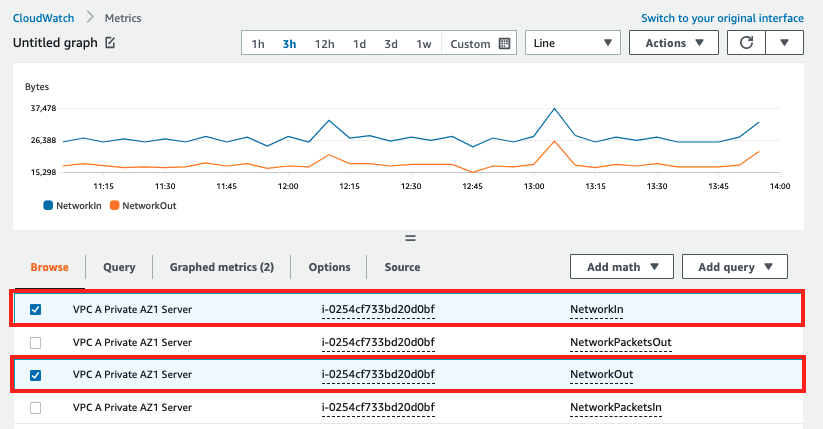
-
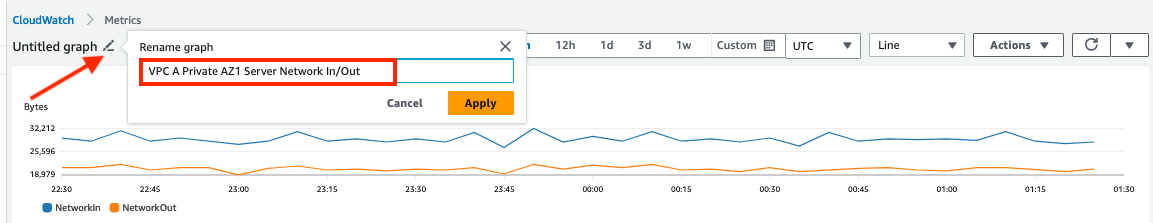
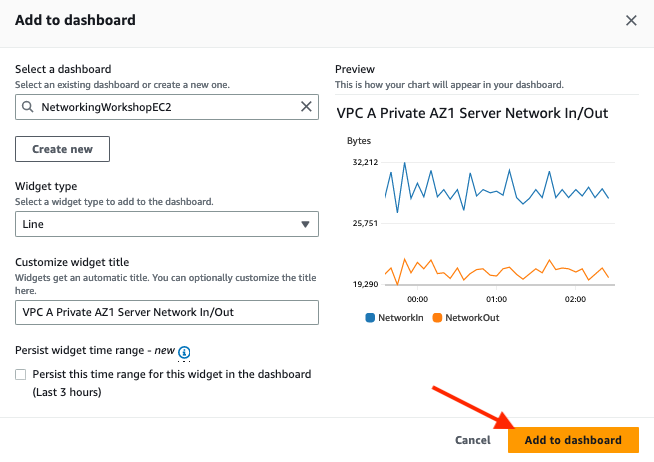
Click on the pencil icon at the top left corner of the graph and enter a name of
VPC A Private AZ1 Server Network In/Out
-
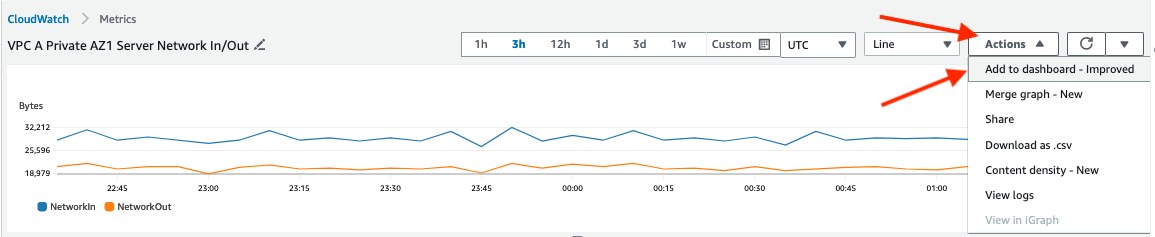
Click on Actions and select Add to dashboard from the dropdown
-
Click on Create new
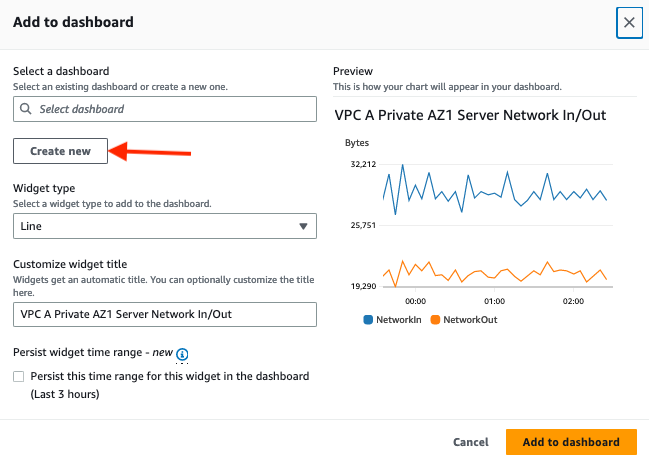
-
Enter
NetworkingWorkshopEC2and click Create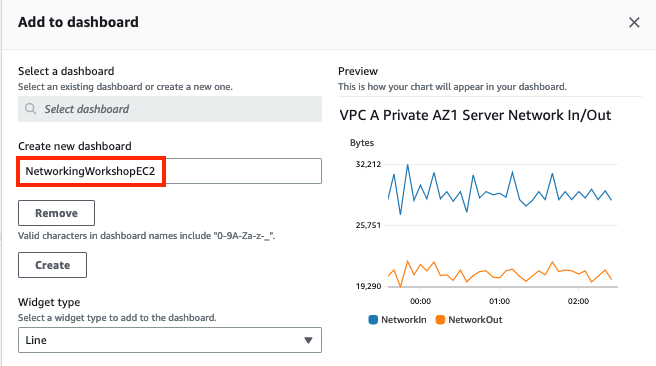
-
Click Add to dashboard
-
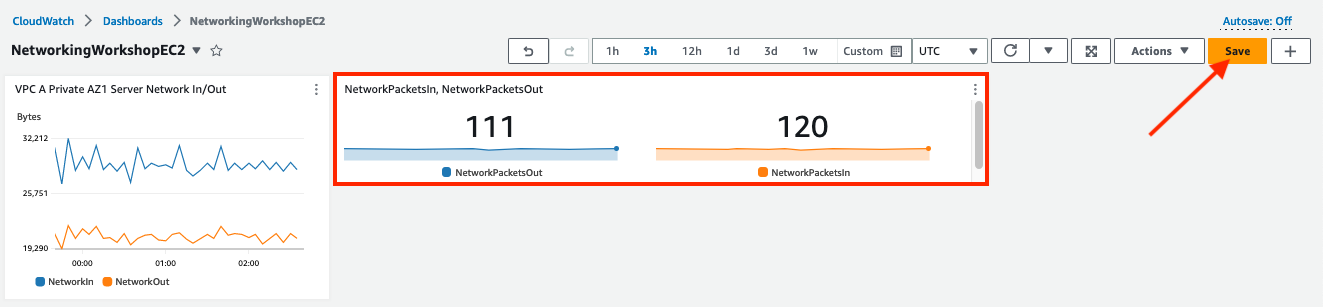
The graph of Network In/Out statistics in bytes for the EC2 instance will be added to a new dashboard. To add Packets In/Out statistics click on the + in the top right corner to add another widget

-
In the Add Widget screen select
Number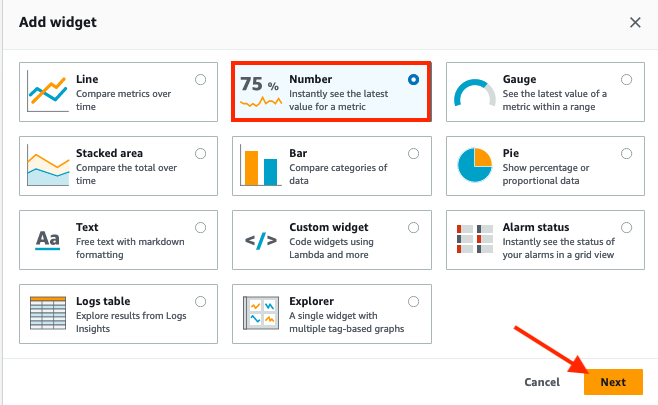
-
Click on EC2
-
Click on Per-Instance Metrics
-
Enter
NetworkPacketsin the Search box and select the two lines forVPC A Private AZ1 Serverand click Create Widget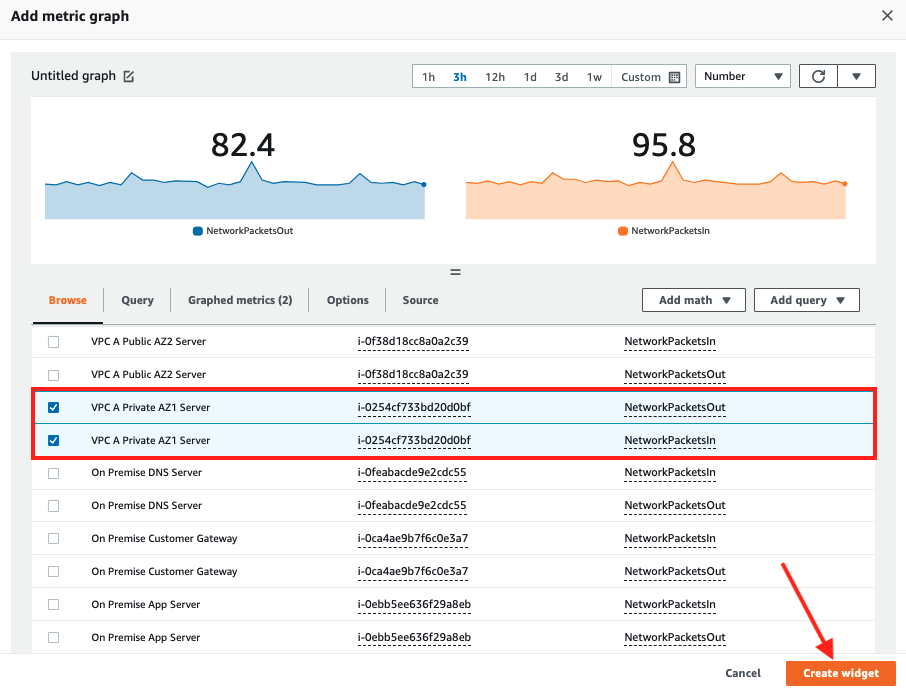
-
The new widget will then be placed on your dashboard, click Save to persist the dashboard.