Review Automatic Dashboards
Amazon CloudWatch dashboards are customizable home pages in the CloudWatch console that you can use to monitor your resources in a single view, even those resources that are spread across different Regions. You can use CloudWatch dashboards to create customized views of the metrics and alarms for your AWS resources.
-
Navigate to the CloudWatch console
-
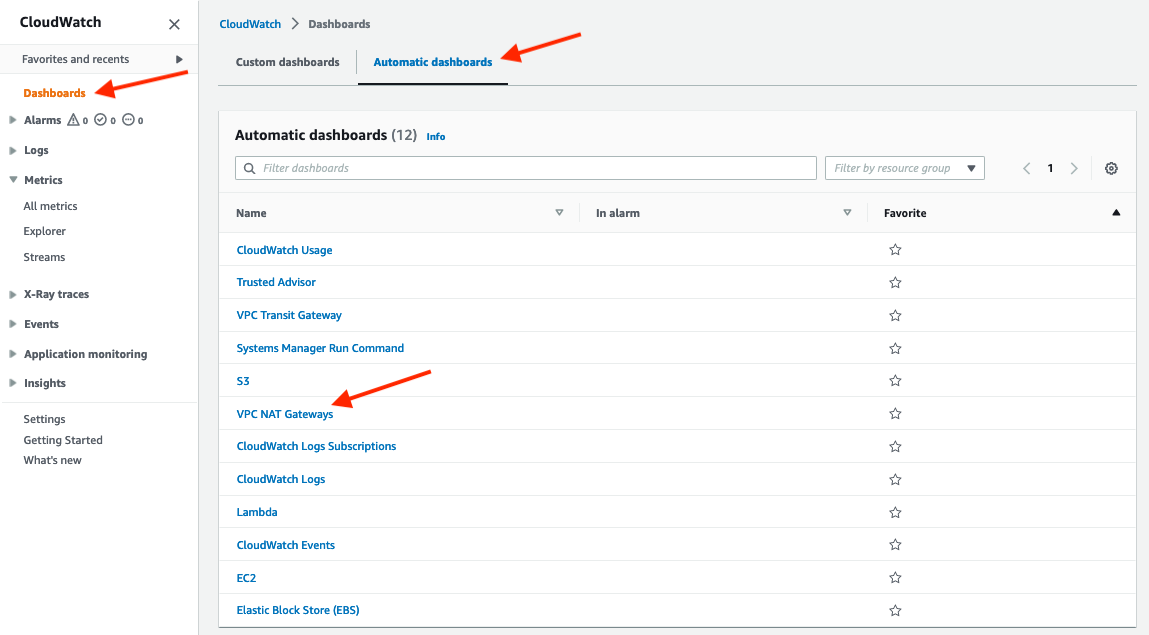
Click Dashboards, then click Automatic Dashboards and VPC NAT Gateways
-
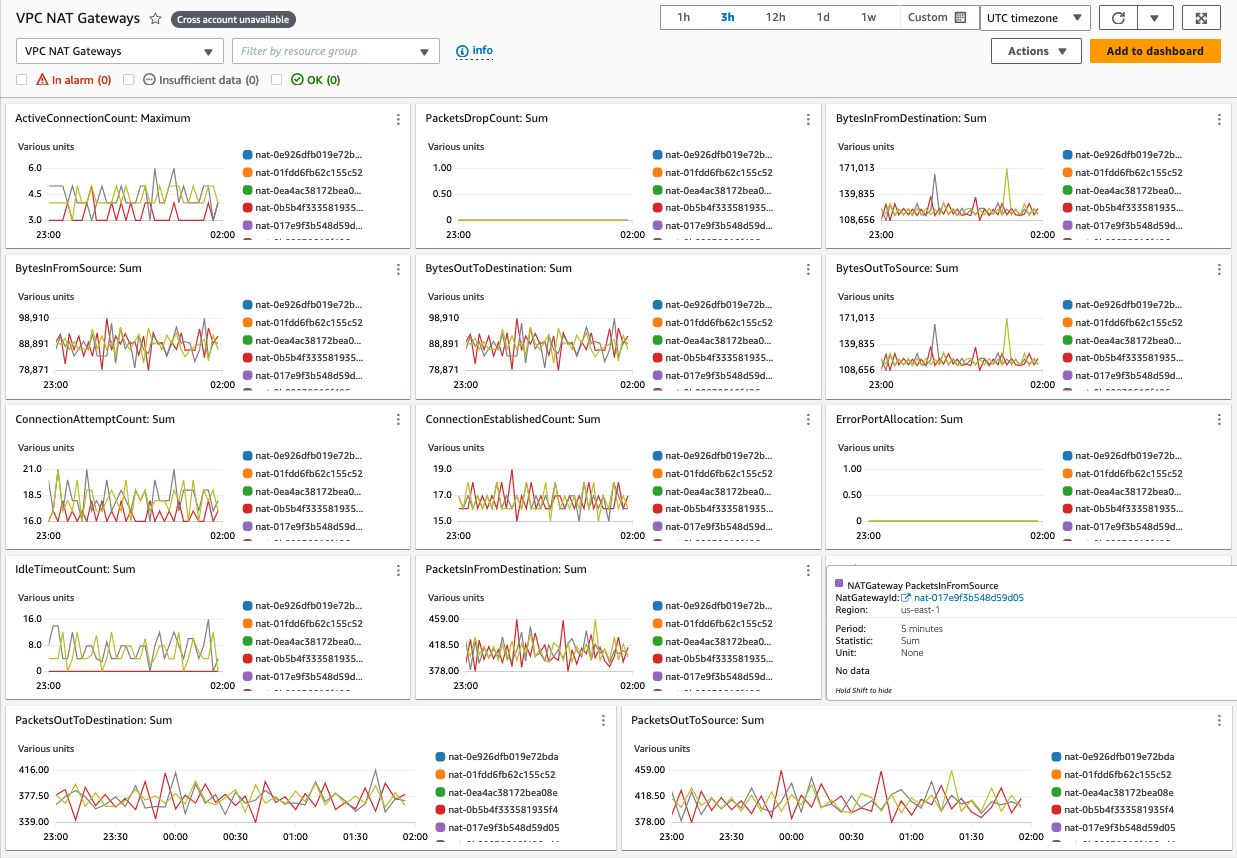
A dashboard will be shown that contains the key network metrics for NAT Gateways
-
Review the metrics